
I, like many others, have used the word “dollar cost averaging” countless number of times. We use it when asset prices are going up and when they are going down. We treat it as the holy grail for the rational investor. But never has anyone put it in proper perspective as I am going to put it for you in this article.
The concept of (dollar) cost averaging means if you have a lump sum, $1,000 to invest, instead of investing it at once, you spread it over let’s say 10 months and buy $100 in each month. That’s usually advised because you are not sure if the asset (ETF or Stock) is at its peak by the time you want to buy it or not. As such you should avoid buying the asset with the lump sum and do a cost averaging instead. That way, you even out the effect of buying at the top and benefit from different swings that may occur during your buying period.
What that implies is that if all you do is to take $100 out of your salary every month to invest, then that’s not cost averaging. That’s just doing what is only feasible and available.
Although now, we call everything cost averaging. That’s fine. Let’s bother about the substance here and leave forms alone.
That said, what advantage can cost averaging have? Or even taking an amount daily/monthly to invest in an asset?
The perspective
One of the biggest dilemmas that we all face whenever we want to invest is what if the asset (ETF, Stock, Bitcoin etc) is currently trading at its peak price. Meaning once you buy it the asset probably stops growing or starts to decline. That’s not something that anyone wants even if they are keeping a long term view as expected.
(Dollar) cost averaging is the buying strategy that will come to the rescue here.
Example 1 – Let’s assume the date is September 2018 and you have just been introduced to stock market investing. Having gathered enough understanding, you chose to invest in Amazon stock, being a good company with strong fundamentals. Unbeknownst to you, Amazon was trading at its peak price that day as shown in the image below. And for the next 200 days, the price didn’t recover back to that peak price.
If you employ the strategy of cost averaging, during this period, you could still have made a return of about 17% on your investment.
The assumption for this particular calculation is as follows.
- Your first purchase was made at the highest price and you bought one unit of Amazon shares.
- You bought one share every trading day of the week for 200 days until recovery. By implication, at the end of that 200 days, you own 200 shares of Amazon.
- At the end of the period, you would have invested a total sum of $345k and the value of that investment would be $403k. Giving you about 17% ROI even though technically, there’s been no growth for the asset over that 200 days.
- See this Google Sheet for the calculation.

Example 2 – the same argument and process are involved here. Your first purchase was at an all-time high after which the price started to decline. Except that here what we are buying is an ETF. Despite no growth in asset value over the 150 days, you still made an ROI of 9%.
See this Google Sheet for the calculation.
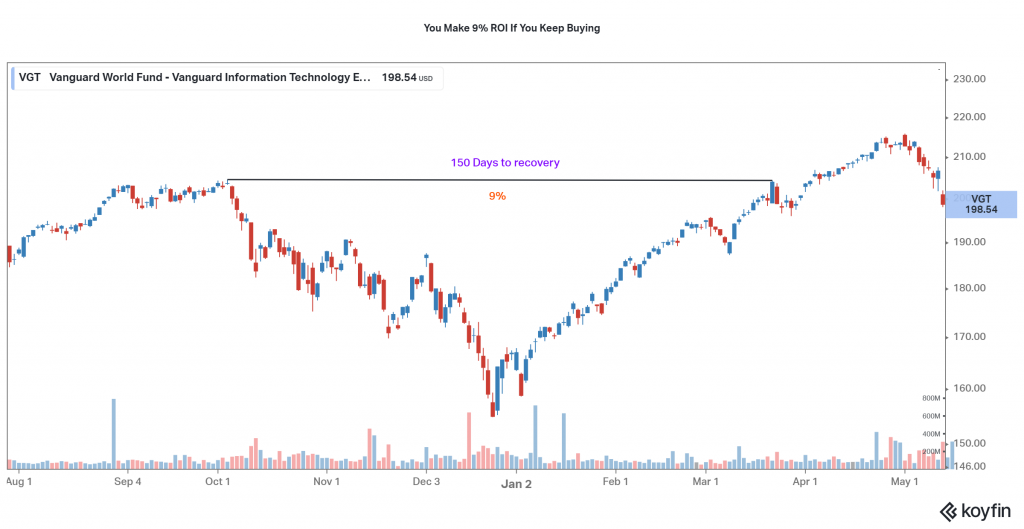
The explanation here is that buying on a scheduled interval pays off over the long term. I’ve assumed the worst scenario to say you bought at the peak then the price starts to decline. Yet, you can see how you can still make money in such a chaotic situation.
The alternative to that of course is to try and time the market. But if you have tried that before, you will agree with me that it is a skill that ranges from difficult to impossible to achieve. That’s accompanied by a lot of headaches.
That’s why this favourite article of mine is so relatable – Just Keep Buying
There’s a problem with that strategy though. It assumes that the asset price will recover and they don’t always do.
The only criteria for cost averaging to make sense
Now that you understand the perspective with a real-life scenario, I want to tell you the only criteria where the strategy makes sense.
As you’ve seen, I used an extreme example. A situation where your first purchase was at a peak and it continues to decline and didn’t fully recover until some 200 days later.
The only question you have to ask yourself then is, will this assert ever fully recover and return to growing? Once you are optimistic that it would, then you can proceed with your investment till forever.
That’s a big question though and it can be really difficult knowing which asset will recover. It’s the reason why I have a bias for board market ETFs. Because betting on them would be betting on the entire human ingenuity. And if history has taught us anything, it’s that human ingenuity will always prevail.
Also read – How To Start Investing
And in case you don’t know, not all individual stocks recover and while some may even do, they may take longer than what the human capacity can bear.
All assets don’t recover from a fall
Let me share a couple of examples of assets that never recovered or took way too long to recover.
Microsoft took 14 years
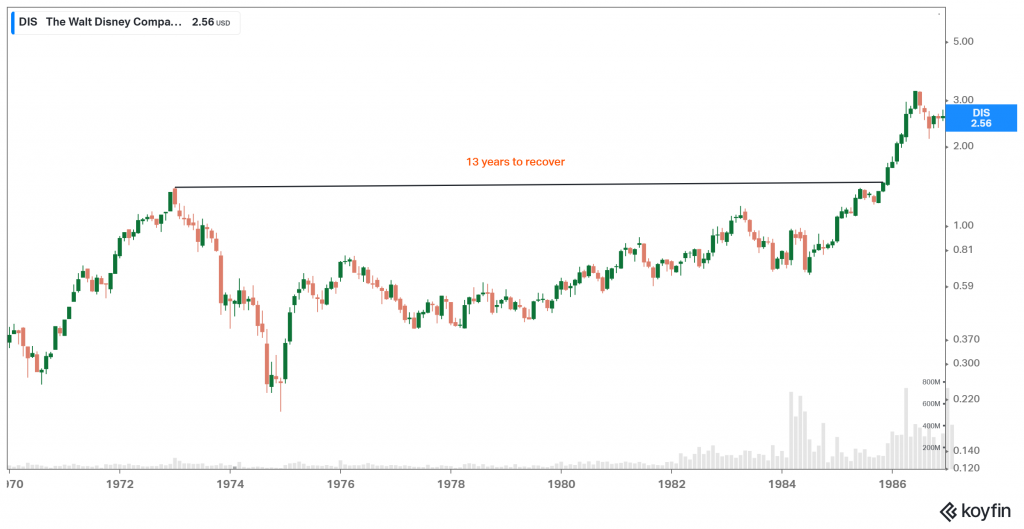
Walt Disney took 13 years

I could go on but you get the point already.
On the other hand, if you bet on a broad market ETF for example, you can almost always be sure that they will recover and it won’t take long.
- These are the huge falls and recovery of VGT during 2020, 2018, and 2008. All recovered and as noted above, you would have made a 9% return during the 2018 fall.
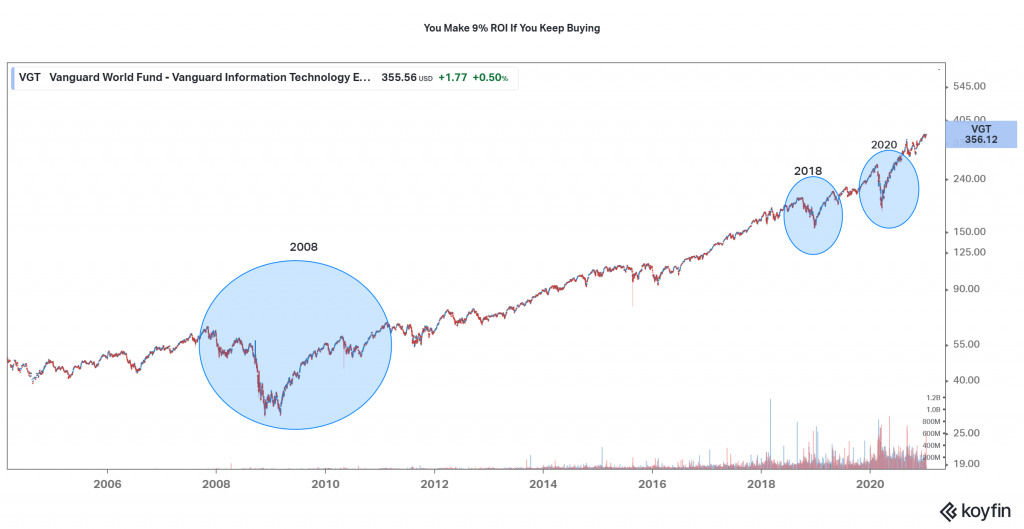
- Same goes for SPY and VTI check them out. Learn from history.
Now you understand cost averaging what’s stopping you from leveraging it. Will you allow greed, fear, hope and or ignorance the 4 horsemen apocalypse of the stock market to hold you back?
Join 300+ people who are subscribed to my newsletter via this link to get notified of future posts like this and more.